Not long ago I wrote a quick introduction on PGX, Parallel Graph AnalytiX, the Oracle graph solution. You can find it here: PGX – Parallel Graph AnalytiX : the Oracle graph analysis brain.
To use and interact with this graph engine you will need a client or a programming language having an interface to it, and Oracle, wanting to make things nicely, provides multiple options for it.
Choose your preferred solution
If you install PGX itself (which can be done by having Java 1.8 and unzipping the file you get from OTN) you end up with the PGX Shell.
It is probably the simplest way to use PGX as it’s not just a shell but it’s PGX itself (when not running it as a server). All the tutorials have samples providing the PGX Shell code, and it’s also probably the best way to start with PGX and graphs.
If you are using PGX as part of the Oracle Database 12c R2 (what they call the “Oracle Spatial and Graph” software package I believe) or the Big Data one (what Oracle calls the “Oracle Big Data Spatial and Graph”) you will have a groovy interface. A script named gremlin-opg-*.sh (where the * can be “rdbms”, “hbase” or “nosql” based on the source you want to use to load graphs) is used to start the interactive shell or to execute scripts.
If you are a user of notebooks and want to use Apache Zeppelin nothing could be easier: a Zeppelin interpreter is provided by Oracle. Extremely simple to deploy (unzip and configure following the tutorial). The interpreter gives you the same as PGX Shell in a Zeppelin notebook. This is actually the best option, in my opinion, to start exploring the PGX graphs world as it allows you to easily document what you are doing by adding markdown blocks all around your PGX commands.
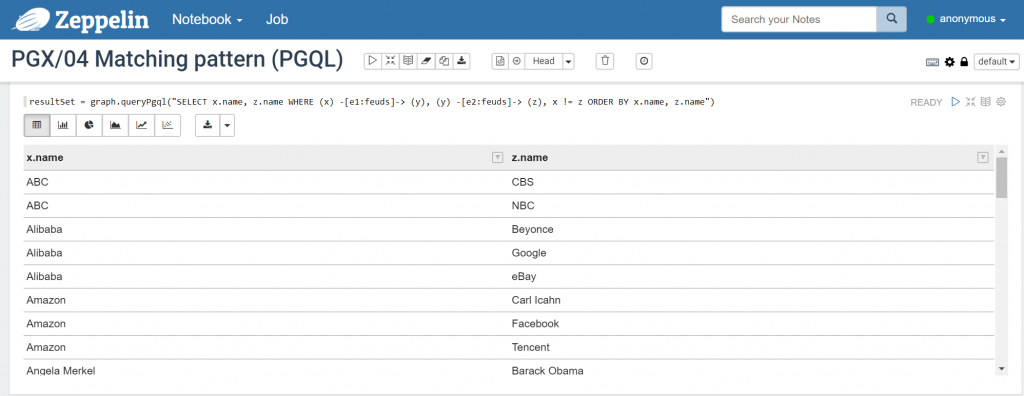
In addition to the advantages provided by Zeppelin itself the interpreter implemented some Zeppelin visualization to display the result of some commands. For example, when executing a PGQL query the result is automatically visible as a Zeppelin table, allowing you to switch it to a bar chart or few other kinds of visualizations.
Last option is a programming language: if you want for example to use PGX as part of an existing application.
Java and javascript (Node.js) are provided as downloads on the OTN page of PGX, in addition Python is available if you have the “Oracle Big Data Spatial and Graph” or “Oracle Spatial and Graph” package. There inside you will find a Python module for PGX (named pyopg), but this Python module isn’t available as standalone download so far on OTN.
As you can see lot of options, what you will maybe not notice is that all these things use the same way to interact with PGX…
Java: one API to rule them all!
Everything is done in Java !!
PGX Shell is “just” the execution of a JAR file linking all the other JARs providing the various functionality.
Groovy is by definition Java and does the same exact thing.
The Java library is, obviously, Java itself.
Finally, even the Python module provided uses the Java API. The module implements JPype to start a JVM and interact with it by passing commands from python to java and get the result back.
Thanks to this Python module you can use PGX from Jupyter Notebook, another well known and common notebook solution.
The issue is, based on my experience at least, the provided “pyopg” Python module is a bit buggy…
The original version with PGX 2.2.0 was working fine. When updated to PGX 2.4.0, to have support for PGQL, it was impossible to use the Analyst object to execute the embedded algorithms. Python return some Java exception and that’s it.
That’s why I gave up the Oracle python module (and also because not available as download on OTN with PGX 2.4.1) and started to write my own code as the module was just doing the interface between Python and the Java API, so a DIY approach provides better control on what is done, where, when and how.
The Java API documentation is your best friend
As said the Java API is the heart of most of the PGX clients, it’s definitely worth to get familiar with the available classes and methods.
Like often with Java APIs, a good Javadoc is what saves you and allow you to get the best out of the API. With PGX it is the same exact thing. The Javadoc is good, cover almost everything (just one object I couldn’t find but the interface which was implemented in it provided most of the methods I was looking for).
You can find the PGX Javadocs at this link: https://docs.oracle.com/cd/E56133_01/latest/javadocs/index.html
Not everything is implemented …
Important to note that not everything documented in the Javadoc is currently implemented, at least in PGX 2.4.1.
For example when using a ChangeSet it is not possible to add labels on vertices if the graph doesn’t already have at least a vertex with a property.Same apply to properties: if no property exists you will not be able to add it with a ChangeSet.
The ChangeSet will not complain but the newly built graph will not contain it!
If you want to load a graph using the PG, flat file, format (.ove & .ovp files), have a look at the “use_vertex_property_value_as_label” property of the graph config before you load it. This is supposed to take the value of one of the vertices properties and define it as label for the vertices.
Your own Python PGX interface
Using Python is quite easy with PGX. First you need to make sure JPype is available in your setup, you can generally verify and install it if missing with pip install JPype1 .
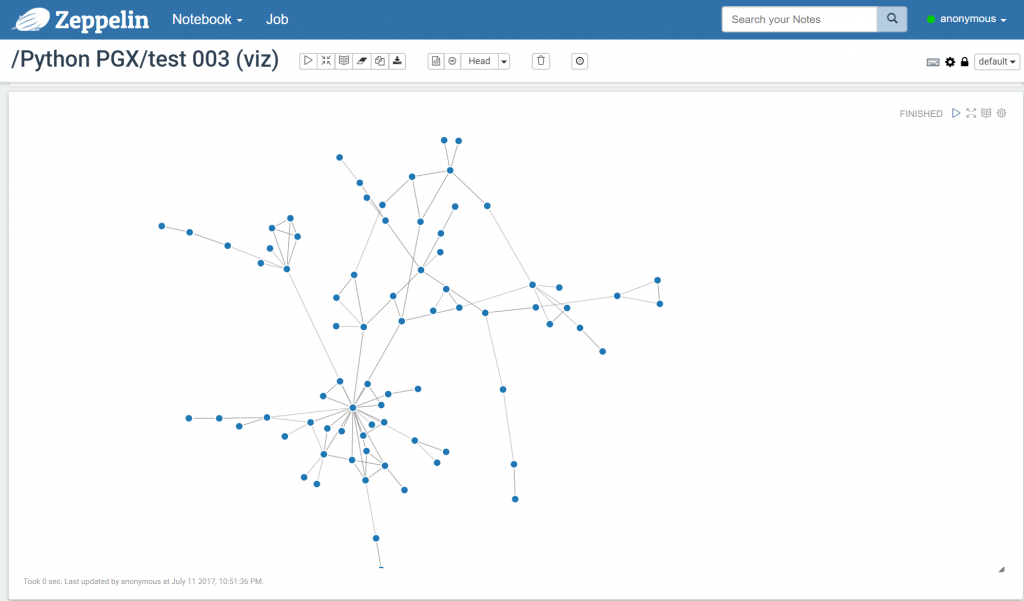
Even though I’m not a Python developer (but having used few other languages for many years it’s mainly a matter of adopting a new syntax) I’m going to release my own version of a small Python class, providing some functions making the interaction with PGX easier and, as bonus, 2 methods for Zeppelin: one will display results of PGQL queries as a Zeppelin table (just like the PGX interpreter does), the second will provide a visualization of the graph using D3js to draw vertices and edges.

Using Python to get the vertices and edges and D3js to build the visualization you can have a view of your graph.
If you can’t wait until I will upload on GitHub the code here are the instructions to get you started with Python:
|
1 2 3 4 5 6 7 8 9 10 11 12 13 14 |
from jpype import * # build the class path to use for Java, linking all the PGX JARs (download the PGX Java client) pgx_jar_classpath = '... set this variable ...' # start JVM (any other param can be added like TrustStore, KeyStore etc. startJVM(getDefaultJVMPath(), "-ea", "-Djava.class.path=" + pgx_jar_classpath ) pgxClass = JClass('oracle.pgx.api.Pgx') # create a session on a PGX server session = pgxClass.createSession('http://pgx-server:port', 'session-name') # load the graph from disk with a JSON file # important: Json file is accessible by python, graph data file must be accessible by the PGX server graph = session.readGraphWithProperties("path_to_the_json_file.json") |
Next on the list is the release of 2 simple Docker images for a PGX server and Zeppelin with the PGX interpreter, the simplest way to have a working PGX environment available (using the PGX OTN release, meaning it will not be possible to source your graph from database, nosql or hdfs).


