Graph Studio is about to join the list of tools on top of Autonomous Database making graph analysis easier. Oracle provides support for property graphs for some years already. In the beginning, it was part of an extra database license pack with Spatial and RDF graphs. In December 2019 the great news came: Spatial & Graph and Machine Learning weren’t paid licenses anymore but free to use with any supported Oracle Database.
Making it free helped in having more users interested in property graphs, but there was still a potential issue: a steep learning curve, which started with the obstacle of installing the product and finding how to interact with it. Yeah, because the full power of Oracle Property Graph is a component called Graph Server (PGX is the historical name) which is the real graph engine. But Graph Server is mainly an engine with a REST endpoint, not a GUI or another friendly way to fully use it.
Before continuing, let me say something…
I do have access to Graph Studio as part of a limited availability program. Don’t ask me when it will be GA as I don’t know, probably in the coming weeks. It shouldn’t be far away (except if major blocking points are found).
This blog post is a global overview of what Graph Studio is and does, and not a detailed analysis of how it does things. I will go into more details in future posts. I did spend some hours using the tool and already made my own opinion on what I like, what I would prefer in a different way and what I don’t like.
Graph Studio is simple
Don’t get me wrong, all the tools existed and it was possible to use them: an RPM installer for Graph Server, an official Apache Zeppelin interpreter, a full Java client, Graph Visualizer (a web-based query and visualizer tool), PGQL (the graph query language), the OPG_APIS database package, and an SQLcl plugin. You better imagine the steep learning curve now: how and where to start?
This is where Graph Studio is going to make it easy for you.
Graph Studio can be seen as the collection of all the existing pieces of Oracle Property Graph connected and exposed as a single tool.
It isn’t a standalone Oracle Cloud product, it is a tool of Oracle Autonomous Database (ADB). Available for both ADW and ATP (Autonomous Data Warehouse and Autonomous Transaction Processing) you find it in the next to the other few tools available with ADB.
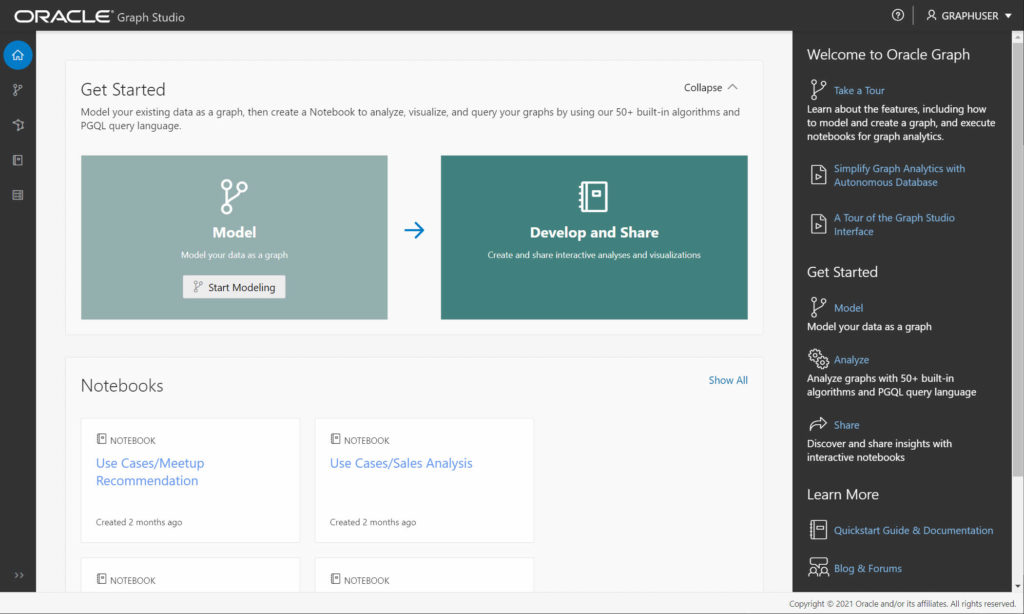
What is Graph Studio?
A webpage is the short answer, a web application the slightly longer one. Fully web-based, it will allow you to perform actions by clicking through screens and wizards, by clicking buttons, toggling switches. In the background Graph Studio will interact with the ADB, will be able to fire up or down computing resources, and will orchestrate various actions involving multiple cloud components.
In this blog post, I’m flying over the various steps of a typical “property graph analysis” task, and how Graph Studio covers them. I will go into more details in future posts.
It all starts with data…
A property graph journey starts with some data. This is the first place where Graph Studio helps in making the journey easy compared to the past.
Most of the time your dataset is available in the database as relational data. If it isn’t and they are files, you can easily load them into ADB.
Graph Studio has an intuitive wizard taking you through the steps to create a graph from your relational sources. It suggests, based on existing primary keys and foreign keys constraints, what of your dataset is a node or an edge. This is the key point of any graph design: identify the nodes and the edges composing your graph, and their properties. The wizard will automatically suggest what of your tables become nodes and/or edges.
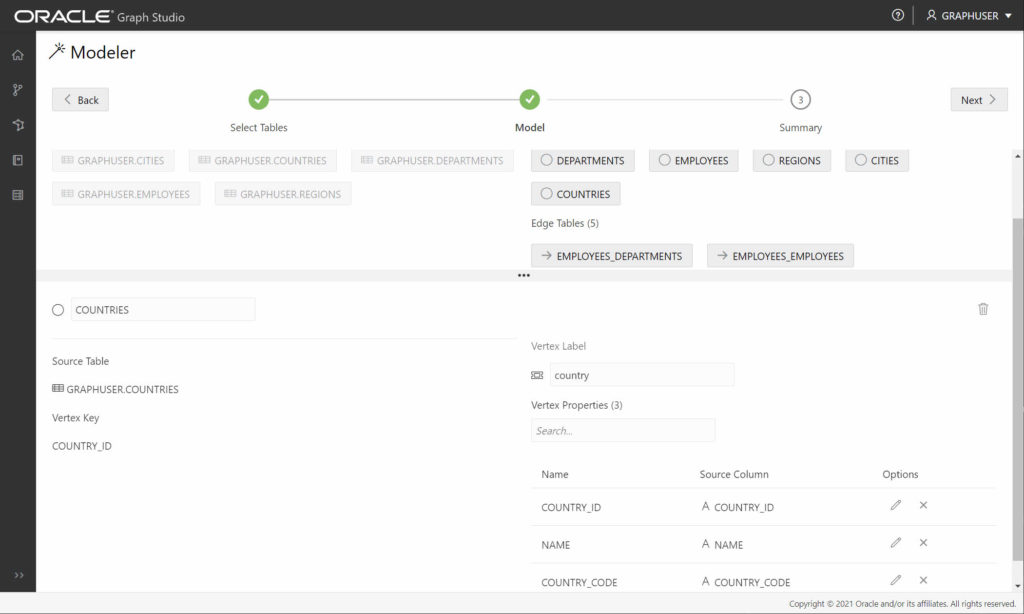
You will be able to see the structure of your graph, and seeing it is generally the best way to know if it will do what you are looking for or not really (the same dataset can be modeled as many different graphs: they are all “right”, it depends on what is your need).
Through your browser, you will be able to click around to select and deselect properties, rename elements: build your graph structure.
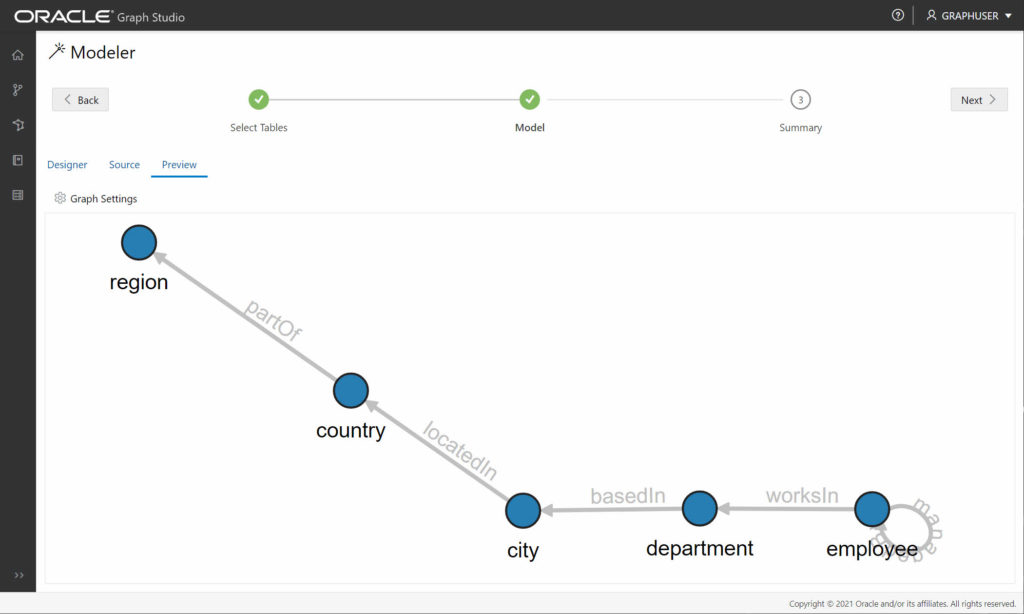
Is it all “click, click, click”? Not at all, the wizard also shows you the code it is generating. You have access to the PGQL query used to create and load your graph data. You can upload your PGQL if you have one already or adjust the generated one.
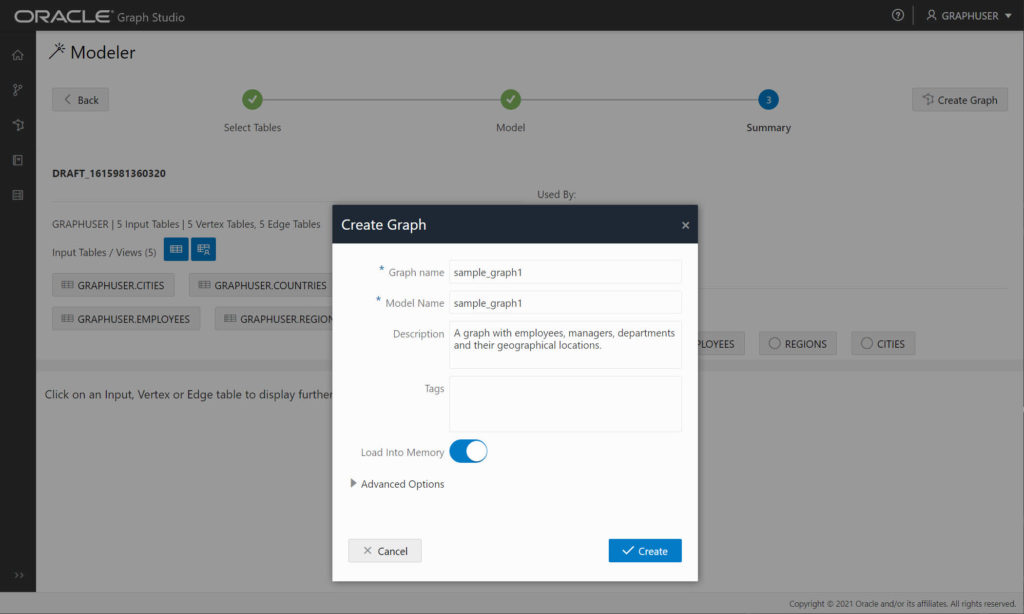
From source data to a graph
Once you designed your graph, it’s time to bring it to life. You can decide to only generate the graph in the database, to create the Property Graph Schema Objects containing the graph. Or you can decide to not only create the graph in the database but also load it into Graph Server in memory, for powerful analysis, algorithms execution, machine learning, and a lot more. What is, without Graph Studio, a bunch of Java and PGQL in a JShell session, is a one-button-click now.
Simple queries don’t need the in-memory graph engine
Once your graph exists in the database, you can query it without the need to load it into Graph Server in memory. Graph Studio allows you to run PGQL queries against the database via a webpage. Without Graph Studio, to do the same, you need the SQLcl plugin or the Graph Client JShell (or Groovy) interactive command line.
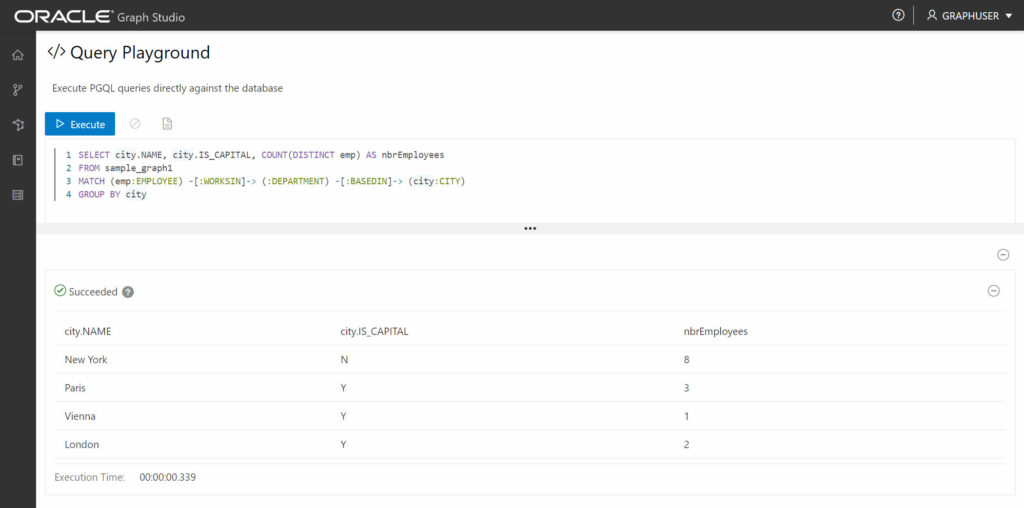
While you can execute PGQL queries on your Oracle database, the database doesn’t speak PGQL at all. This is the reason why the Graph Client is needed in between, to translate your PGQL into standard SQL. Graph Studio does that in the background for you before sending the query to the database.
Unleashing the full potential of graph analytics!
Running simple PGQL queries against the database is nice, but let’s be honest: what you are really after is somewhere else.
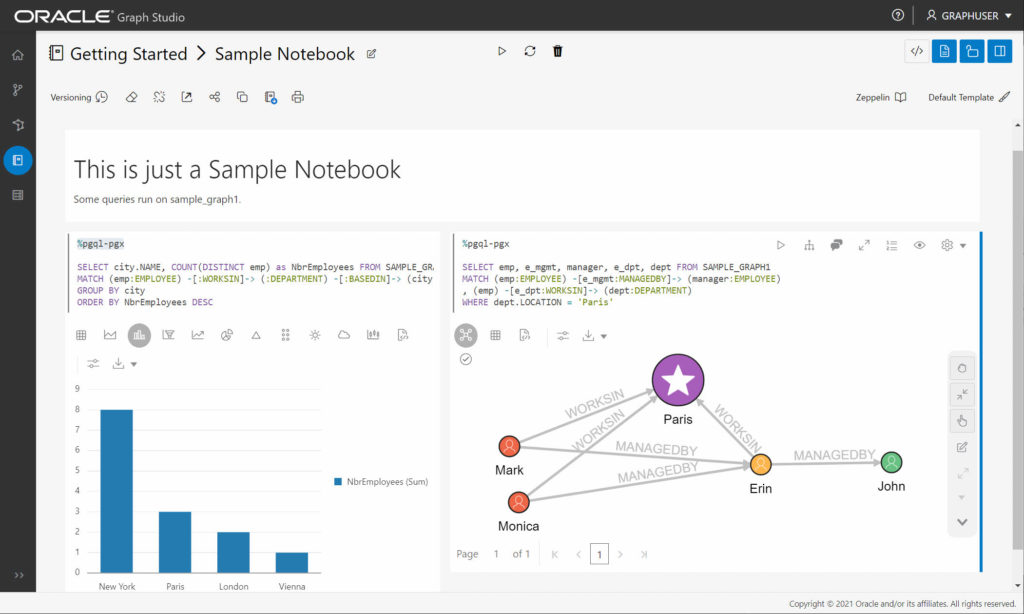
The full power of graph analytics, like complex PGQL queries, algorithms from the most accessible to those requiring a PhD to understand them (joking, but not always wrong) and real machine learning on graphs, is in Graph Server: the in-memory graph engine.
Loading a graph in Graph Server was often one of the first blocking points when wanting to explore property graphs. Graph Studio does it with one click. And once the graph is in memory you can open the notebook (based on Apache Zeppelin) to have a friendly way to execute your tasks. Don’t underestimate the power of a notebook: being able to document the code all around it by mixing markdown paragraphs with PGQL queries and the visual representation of the result or the java calls to execute algorithms. Prompts can be added as well to make the notebook a bit more dynamic. A notebook is accessible to a large variety of profiles, from business to developers.
Without Graph Studio you have to install a notebook (Apache Zeppelin or Jupyter) yourself, configure the interpreter or the libraries needed to connect to the Graph Server. Or you have to deploy somewhere the Graph Visualizer web application, except if you like the command line of the Graph Client and that is enough for you.
Is Graph Studio a miraculous tool?
No, not at all. Although you could have this impression from what I wrote above, it doesn’t do much that wasn’t already possible in different ways before.
Does Graph Studio change the steep learning curve of Oracle Property Graphs? Positive! It removes the technical and infrastructure limitations. Only installing the minimum components was complicated for some, setting up a friendly environment was even more complicated.
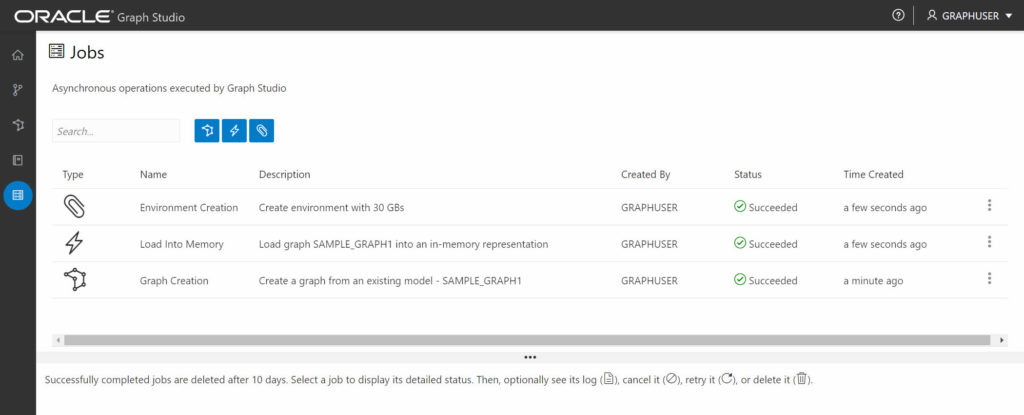
Graph Studio makes property graphs accessible, one click away from your Oracle Autonomous Database. You can focus only on your data, on your graph. Do some real exploration and analysis in minutes. A lot happens in the background when you use Graph Studio, but the most you see is a list of executed jobs and their status and detailed logs.
Will Graph Studio change my life?
I’m exploring property graphs, and more specifically property graphs in Oracle, for almost 4 years now. I was using graphs before Graph Studio and will continue during and after Graph Studio. I develop my sandboxes and development environments (often in Docker images) with Jupyter notebooks, and various other tools, including Oracle Property Graph. I will continue using my own environments because that’s what I custom-tailored to my needs.
The difference is that when I will be speaking with somebody about property graphs and suggesting to have a look, I will not need to send pages and pages of installation instructions, dozens of links to the documentation, and binaries download. You will be able to test graphs very quickly.
About the positioning of Graph Studio, I would say my personal opinion is that it isn’t a tool for running graph analysis in production “live”. It is more a sandbox, a development environment. A place where you can identify useful graphs and graph analysis you will want to deploy to production. The production step would still be done in an independent way (also because of the rules driving production, which shouldn’t allow anyone to change things at any time without control).