I’m not sure why somebody would be interested in my own sandbox environment. Not because it isn’t fairly classic or absolutely generic, but mainly because I believe a sandbox is extremely personal.

My sandbox environment is like a custom-made suit: it must fit me perfectly, tailored as a second skin.
My sandbox environment is just like that, it is tailored based on my preferences, my habits.
You can’t simply copy/paste and hope it will suit you, it’s like “best practices”. What you can do is maybe take some hints or ideas and adapt them to your own needs and habits.
In this post I’m covering my sandbox environment for Oracle Property Graph work and Python-based needs, could it be simple data manipulation and transformation or also machine learning.
Keeping it short: Jupyter
Starting with the TL;DR version of the post for once.
My sandbox is a docker container running Jupyter Lab, Python 3.6 and Git. To be fair I don’t have just one, I have many various docker containers which have different things inside. Some also have R installed and configured as Jupyter kernel, others have Oracle JDK for Java related things. I also have some with Python 2.7.5 in parallel with Python 3.6 for when I’m just trying compatibility things. Last but not least I also have one with Octave kernel installed, that’s what I used for a very famous Coursera Machine Learning course millions of people liked.
Everything starts with a Notebook …
The key element of my sandbox is the Notebook. I personally use JupyterLab.
The two most know notebook solutions are Jupyter and Apache Zeppelin.
Apache Zeppelin is written in Java and has many interpreters, a plug-in which enables Zeppelin users to use a specific language/data-processing-backend.
Apache Zeppelin
https://zeppelin.apache.org/
Web-based notebook that enables data-driven, interactive data analytics and collaborative documents with SQL, Scala and more.
Jupyter is a solution written in Python, it is very well known and support a lot of things. JupyterLab is a more recent, fully reworked, interface on top of Jupyter notebooks.
After the first time trying JupyterLab I just couldn’t stay without anymore: a single interface embedding so many features. It’s really extremely powerful.
Not only JupyterLab is great by itself, but there are plugins, bringing it to the next level. Visualization of various kind of data (can it be maps or multimedia files), interactive forms to bring your notebook to life and so many more.
JupyterLab is a web-based interactive development environment for Jupyter notebooks, code, and data. JupyterLab is flexible: configure and arrange the user interface to support a wide range of workflows in data science, scientific computing, and machine learning.
https://jupyter.org/
What if something is missing? Just write it …
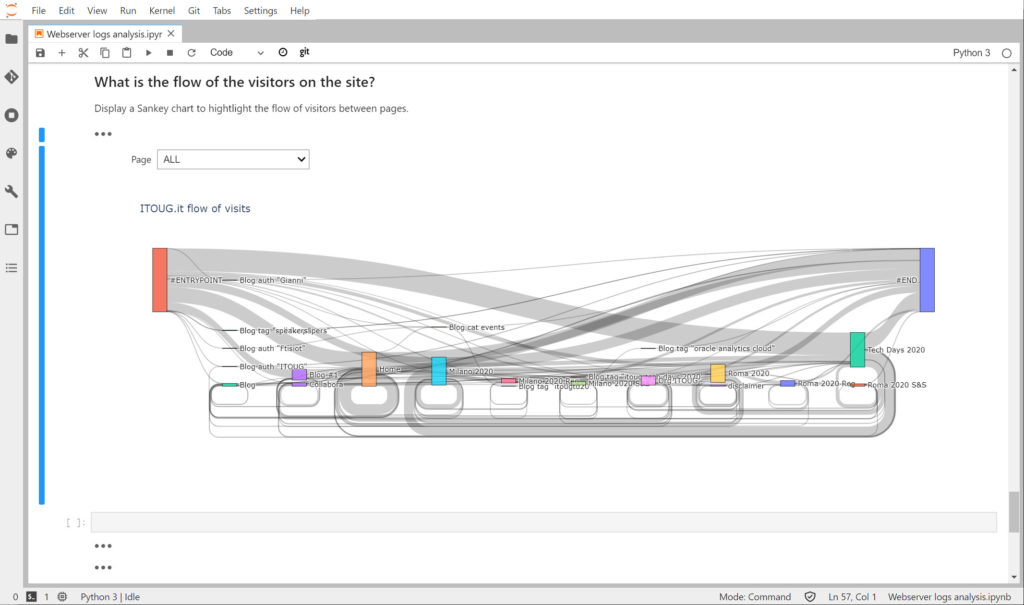
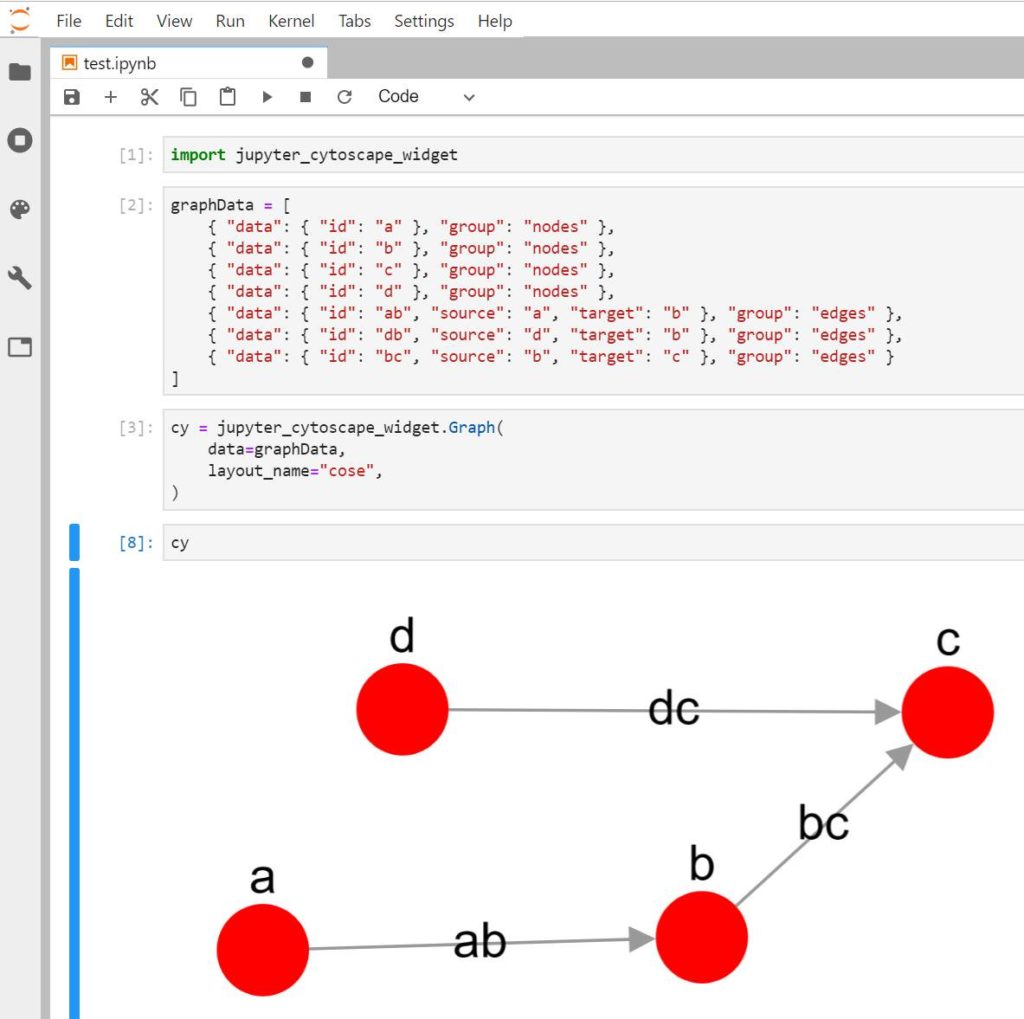
For my work with graphs I wanted to be able to visualize a subgraph or result of a query easily in a notebook. There were some plugins supporting graphs, but I found them either limited or not supported anymore and therefore not compatible anymore.
The solution was simple: I’m writing my own plugin. Using Cytoscape JS to display a graph, quite simple as it’s Python and JavaScript. This will be covered in more details in a future post once it’s ready.
JupyterLab vs Apache Zeppelin
You could say that choosing JupyterLab is a wrong choice knowing that Oracle use a custom version of Zeppelin in their own cloud products. Even more a wrong choice knowing Oracle PGX, the Property Graph engine, had an official Zeppelin interpreter which was available for download till version 3.2.0 of PGX.
There isn’t an interpreter available for the most recent versions of PGX and the API changed enough to introduce incompatibilities, so Zeppelin lost that advantage.
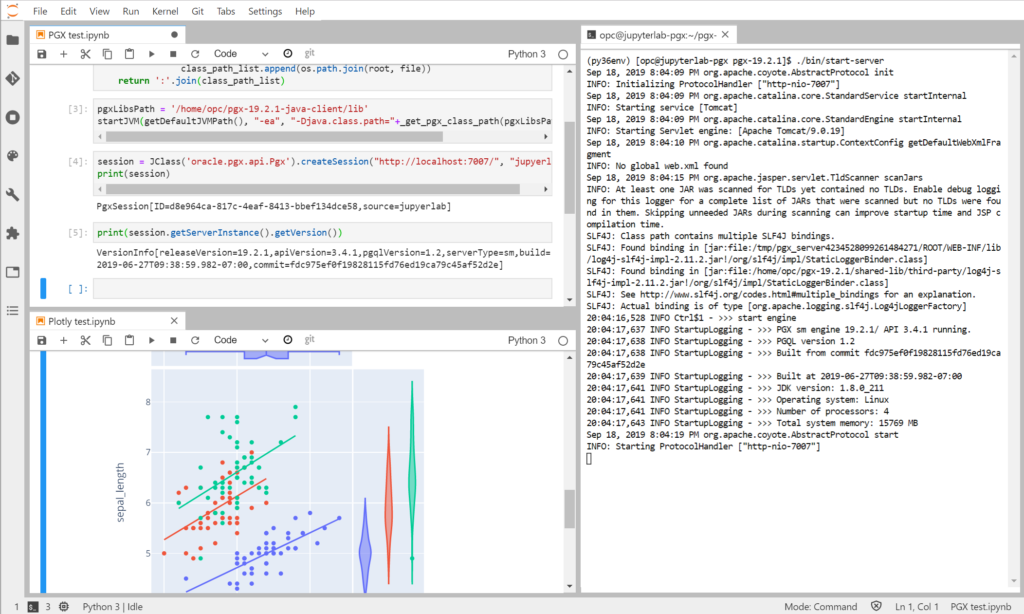
The reasons for my choice are anyway different. PGX is written in Java, all the possible functionalities of the tool are available via Java and the javadocs covers every possible function.
Looking into the code of an old pypgx Python package I discovered JPype, a Python module to provide full access to Java from within Python. By using JPype it’s possible to access any Java method or object giving full access to PGX in an interactive way from Python. Because of that the right notebook solution had to be good with Python.
Both Jupyter and Zeppelin deal with Python without problems. JupyterLab won because of the extra functionalities and great support of many Python visualization libraries (like Plotly or Altair) and few other plugins like ipywidgets which allows to build interactive notebooks, a bit like dashboards.
Another reason is that a notebook running on Python for Python usages sounds also like a logical choice over a Java based solution.
Plugins, libraries and … plugins-libraries
Writing Python code with Markdown comments is good. Be able to re-run it again and again adapting things on the fly is also good.
But what does make it really better? Plugins and libraries.
There are some JupyterLab plugins which I always install by default:
- jupyterlab-git: Git directly in the JupyterLab screen. Allowing to clone repository and stage new changes and push/pull to the repository.
- jupyterlab-toc: Builing a kind of “table of contents” for a notebook allowing to easily jump to various part of the file.
- ipywidgets: adding interactivity to a notebook, like input fields and prompts, and triggering execution of code on change to act like a dynamic page.
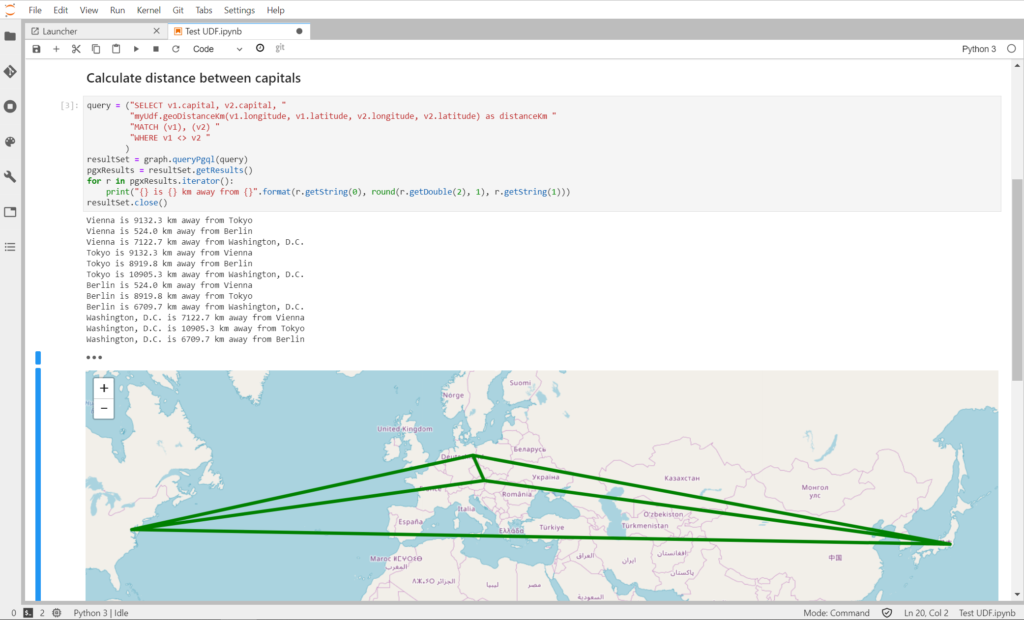
- ipyleaflet: to display maps and geographical related views, which also embed nicely with ipywidgets becoming highly interactive.
For the libraries a full list would be pretty long as Python has libraries for (almost) everything. The ones which can’t be missing in my sandbox are:
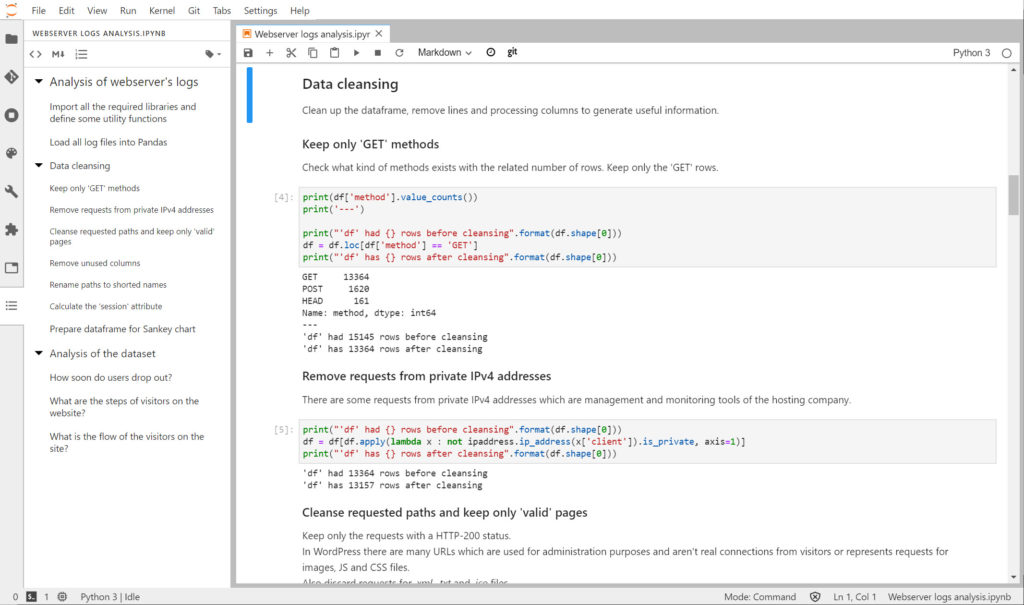
- Pandas: to work with sets of data and doing manipulations. From loading, to transformation, to export.
- Numpy: a highly optimized library for storing and manipulating data, it just works hand in hand with Pandas.
- Plotly: a graphic library which can easily display tons of kind of charts.
- PyTorch, TensorFlow, scikit-learn: Machine Learning libraries of course. There are many doing multiple things, but these 3 are, for me, the most practical ones.
- ipywidgets, ipyleaflet: the JupyterLab plugin is one piece, but they are also Python libraries.
That’s it, this is how my sandboxes generally looks like.
I find it extremely quick to start JupyterLab, prepare a little PoC and push the notebook to GitHub for future usage.
My whole work on Property Graphs is also fully JupyterLab based: this is how I build, load, store and manipulate graphs. And how I run queries and turn results into Plotly visualizations using a Pandas dataframe.