I wrote about the challenge GDPR represents when dealing with an analytical platform and gave some hints on the possible answer. In this post I would like to go a bit more into details of “the” solution to make a GDPR assessment possible in OAC/OBIEE or just any similar analytical platform.
Data Lineage to the rescue
As said, a possible way to keep under control “who can access what data and how (and why)” is data lineage: it can help as it allows to follow every bit if information from the source (database, cube, XML file etc.) through the various components of the stack and finally end up on the screen of the consumer (or in a file generated somewhere).
What exists out of the box?
The “little” detail is that, out of the box, there isn’t such a thing available. It’s up to the user to collect some of the existing information and connect pieces as much as possible.
Catalog Manager reports
Catalog Manager allows to generate reports, they can provide an overview of what the catalog contains although some pieces are missing (hierarchies? Don’t look for them in Catalog Manager reports, you will not find them). Can return references of objects likes which analysis in referenced by which dashboard page, the subject area and columns used in an analysis, filter or prompt etc. But still it stays at the catalog level only.
Repository Documentation
In the Administration Tool (for the RPD) it’s possible to generate a Repository Documentation, which export in an Excel file (CSV) the various mappings of the 3 layers of the RPD. One of the problems is that with a big RPD (OBIA anyone?) the file is difficult to read because it’s a N-to-M kind of relationship between the various layers. And aliases are also missing, aliases which can easily become a nightmare as they are there, while being not really exposed in the Administration Tool.
Usage Tracking
Last but not least Usage Tracking: this one works quite well. It records BI analysis executed on the server, tracking the various executions. But what’s the problem with it? Well … when you see something in Usage Tracking it’s just too late, the “thing” happened already and you can see that as: “I saw that user XYZ exported the whole list of clients of the company with their whole personal information and contact details”. Nice, you saw it … But in the meantime, the list is maybe already on sale on a website or in the hands of marketing companies.
Data Lineage on Steroids
So what can you do if the out of the box solutions have holes and gaps you can’t fill? How can you perform your GDPR assessment?
The answer, luckily, exist! It is possible, by using options/tools the analytical platform provides, to collect all the metadata, lot more than what you can imagine and of better quality than the out of the box options. It just isn’t a “next, next, next, finish” process.
Web services are the answer to obtain data lineage metadata. Via web services calls it’s possible to collect all the RPD, every single bit of it, including the aliases. Some other calls and you can get the whole catalog including the XML of every object, the security, the shortcuts (like symbolic links). Inside the XML there is the reference to columns, hierarchies and levels exposed in the presentation layer of the RPD. A last call provides all the privileges and the list of application roles, groups, users known by OBIEE/OAC.
I covered some of the technical details on how to get these information in a presentation, “GDPR & You: The Nightmare of Business Analytics”, which I delivered few times already this year, have a look at the slides for more details.
Security? Make it “flat”
As part of the Data Lineage on Steroids there is the whole security model. Knowing all the data flows is one thing, knowing exactly who can access what is something else. Too often (always?) security models are a kind of patchwork: it starts with a model and a strategy, a bunch of extra layers of quick-fixes after and finally some “desperately add random application roles” to make the business stop complaining they can’t see their data. The result is just a real jungle!
Even when the security model is clean it isn’t easy to clearly see the impact of the various levels of inheritance: a user can be part of various groups in a LDAP. These groups can be part of other groups. A user or a group can be member of an application role, which can itself be member of another application role. Translate this inheritance to a company with 500, 1’000 or 2’000 users and you see the problem.
In the end, to have a clear view of the security you need to collect all the members of each application role, all the groups and users stored in the embedded LDAP in Weblogic and also the users and groups of the corporate LDAP.
Data Lineage on Steroids – The Swiss Army Knife for GDPR assessment
Now imagine: what if you take all the above information about data lineage and security, a programming language, you shake it and you get a tool doing that automatically? Wouldn’t it be nice? “Been there, done that …”

Data Lineage on Steroids – Swiss Army Knife for GDPR assessment
Automation / Script as the only solution
All these things like web services, LDAP etc. can’t really be consumed by hand: too complex, lot of work, results are mainly in XML or JSON.
But any programming language can definitely do the job. I decided to do it in Java, mainly because it is the only one existing almost by default on all the systems and OS. Linux, Windows, Mac: they all have Java available. Worst case the BI server definitely has it because it’s required by OBIEE itself.

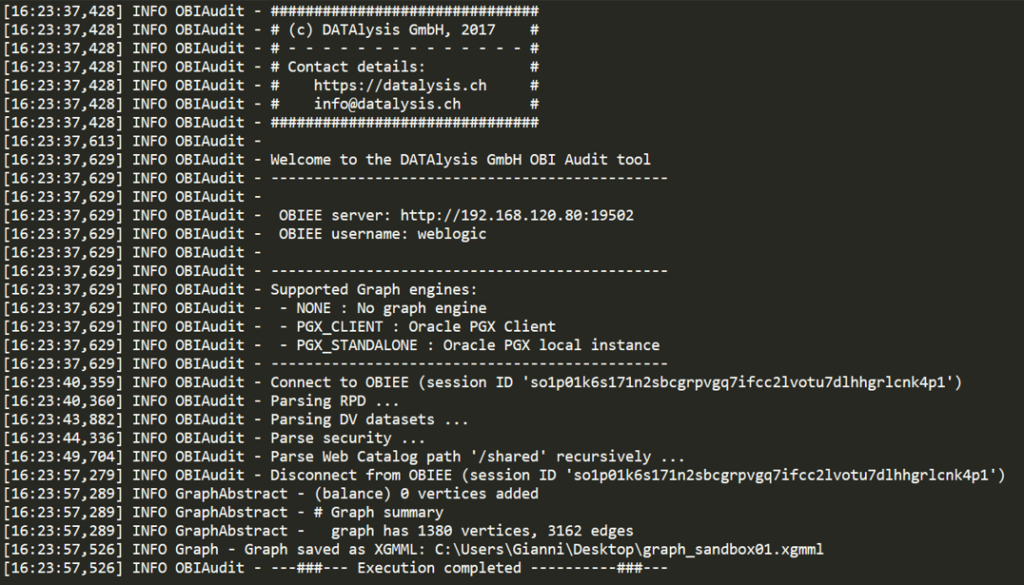
With some Java all the web services calls and treatment of the results is easily performed and returned as a graph
In Java it is really easy to consume the OBIEE web services and process the returned XML, there are libraries allowing to process JSON and finally it’s possible to generate the result in multiple formats.
Graph database to store the data lineage metadata
All the output formats are graphs representations, from a simple XGMML file to Json, from an Oracle graph (in the PG flat file format or the binary PGB or SQL directly) to a Neo4j graph. The output can easily be adapted by coding an appropriate output class if required.
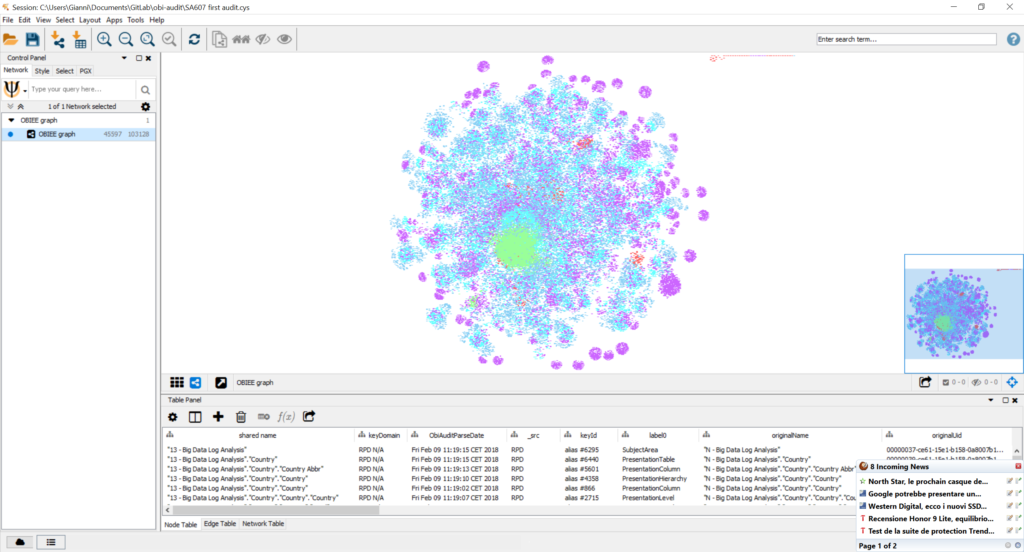
Just as a reference OBIEE Sample Application v607 generated a graph with about 45’700 nodes and 105’400 edges. It’s still a quite small graph although big enough to make “manual” analysis difficult.
Of course it was nothing in comparison with OBIA deployed on OAC, without security as it was just a test deployment: about 850’400 nodes and 1’717’600 edges. This is already an impressive graph for “just” data lineage. Manual analysis is clearly impossible on this kind of graph and that’s why the special algorithms for graph analysis are useful.
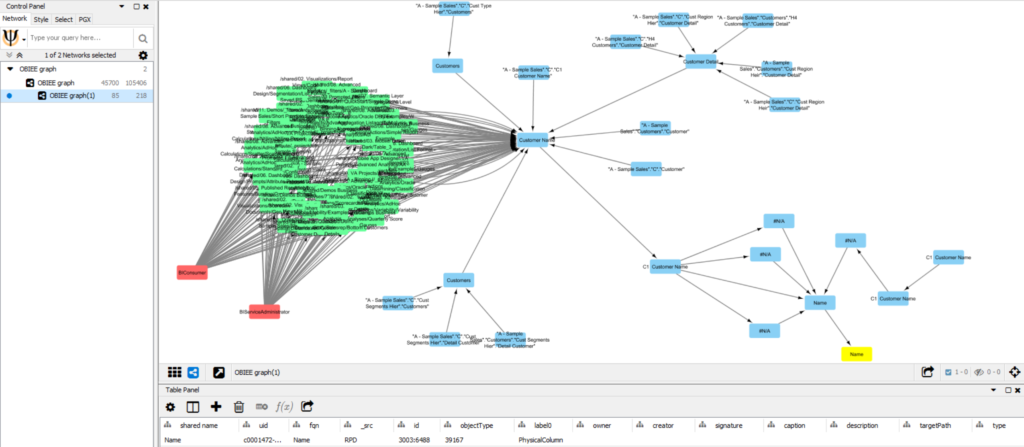
For example, starting from a list of “flagged” nodes representing GDPR sensitive data in the database (tables / columns) it’s possible to execute a “shortest path” algorithm to obtain all the analysis referencing these information, making the analysis “GDPR sensitive” as well. From there the next step is the link with security to identify all the users having access to those analysis and the result is a GDPR exposure matrix. This is a document a human can easily evaluate and define if it’s an acceptable risk, if actions need to be taken to restrict access or directly remove the source column from the analytical platform.
I already wrote a bit about graphs and more is coming in the future, focusing also on analysis of graphs. You can find the current and future content in the “Graph” category.
GDPR & Analytics : the Solution
In these 2 blog posts I wanted to highlight why Analytics can be a real problem for GDPR and also that many seems to have forgotten this “detail”.
But I also highlight the solution to make sure there aren’t issues.
It isn’t there out of the box but can be easily implemented, can also be packaged into a tool, making GDPR assessment a lot easier and allowing to focus only on the analysis of the data instead than spending time trying to collect metadata.
If you are interested in this topic and want to know more about it feel free to get in touch.


