This is my contribution for the OTN Appreciation Day, an idea of Tim Hall.
It’s difficult (almost impossible) for me to find my favourite feature of an Oracle tool. I can easily say OBIEE is my favourite tool, but can hardly choose a feature as being my favourite. So I will take one that I liked long time ago and still use quite often as it’s really simple but powerful in the same time:
“Show Data As” option on a measure column in a pivot view in OBIEE

“Show Data As” : in a pivot you have it as an option on the Measures columns
With just one single click you display your measure as a percent or an index of other components of the analysis: column, row, section, page, parent row, parent column etc.
No need to write any code, no need to find out how to calculate the total of a subset of your data, what level to use in the AGGREGATE(…. AT ….) function. All you need is a simple “click” and select what you look for.
Let me show you few examples….
You start by creating an analysis in OBIEE and select few columns, when done you move to the results screen and add a pivot. Till here nothing special, a simple standard basic analysis, you have a nice pivot showing Revenue by Brand, Company and Year.

Starting pivot with the real measure on the screen
You are now interested in the split by company of the revenue by brand and year, so how much did each company contribute to your yearly revenue by brand of product. How to do it? A simple click on the measure and select “Show Data As” > “Percent of” > “Row”.
What if you want to see the split by brand and company over the year, to see which brand in which company gave you the higher revenue? Again it’s a click … Moving the year as section and selecting “Show Data As” > “Percent of” > “Section”.
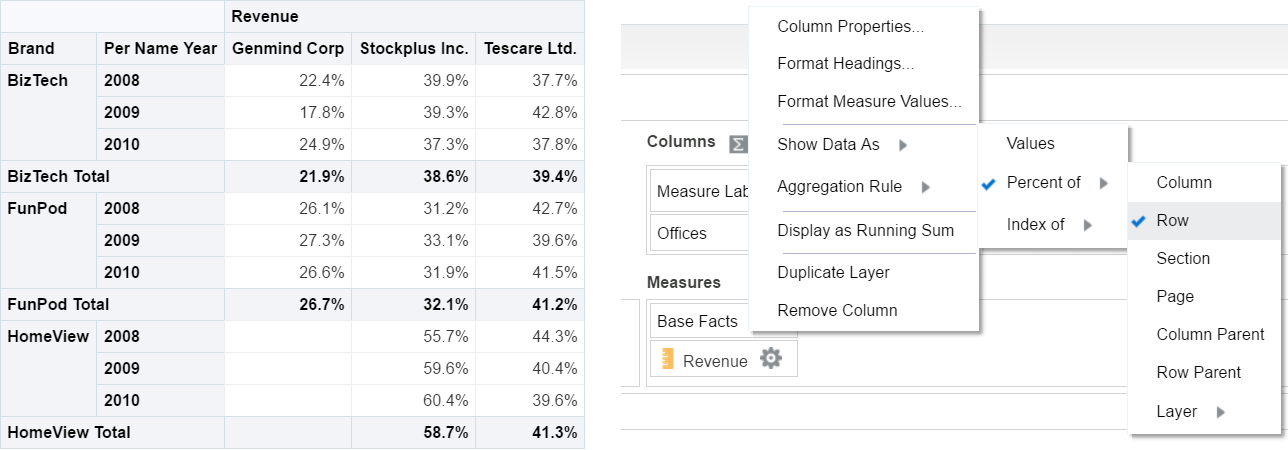
Display the measure as a percent of row
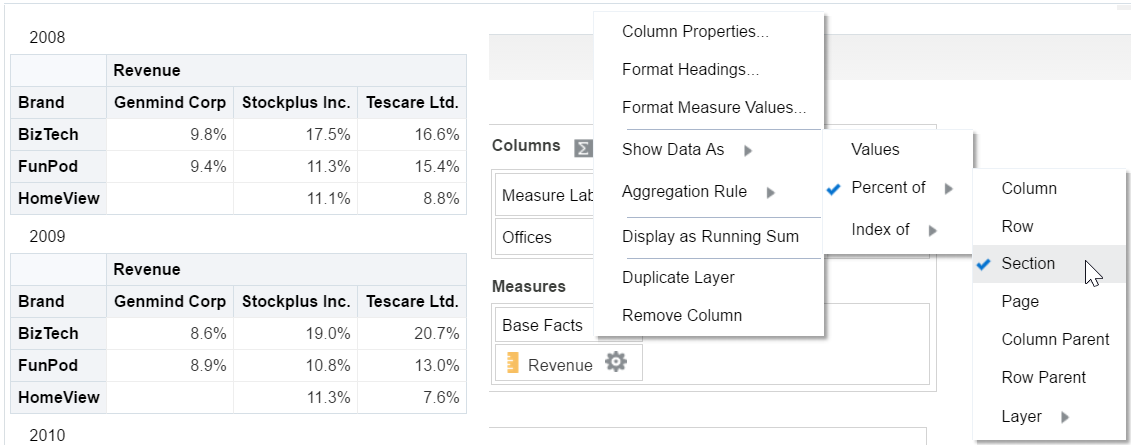
Display the measure as a percent of the section.
As you can see it’s extremely simple and just imagine for a second the formulas you will need to be able to calculate the same values by hand (or just by SQL): finding the aggregated measure at a different level (most of the time a subtotal), calculate the % of the current measure compared to the aggregated one and manage the case when NULL or zero (to avoid division by zero error etc.).
Don’t get me wrong: I don’t say it answers all your possible questions and needs, but for a quick “% of” it’s often enough. Would actually be nice if Oracle could add it to table view as well (just for columns of course).
This little feature I use it not only to display measures as % (in general I duplicate the layer and display the real measure and next to it the percentage) but also at the beginning of projects to better understand data and relationship between the various attributes. It’s a simple way to quickly analyse the data and see the distribution across the various attributes and this information help me identify the best chart for the use case, the one able to highlight a special behaviour in my data: it’s act as data exploration and analysis option.