Some days ago, in the MOS OBIEE forum on OTN, I walked into a thread of a user struggling with displaying a Google Map with a marker on an analysis. Of course the marker had to be dynamic based on an address returned by the analysis itself. As the reference used by the user was quite old and the question was about OBIEE 12c I thought it was easier to cover it in a blog post.
First thing to do, split the problem into pieces:
– display a Google map in an analysis
– translate a textual address into a position an the map and display a marker in that location
Display a Google map in an analysis
It must not be difficult to display a map in an analysis as it’s a webpage and there are tons of sites showing google maps, so to find the solution to this one … let’s google it!
https://developers.google.com/maps/documentation/javascript/examples/
All the examples referenced by the Google Maps JavaScript API documentation. The source code is provided and easily tested in JSFiddle.https://developers.google.com/maps/documentation/javascript/tutorial
A set of tutorials driving you through the various steps and explaining how and why do things.https://developers.google.com/maps/documentation/javascript/get-api-key
Google maps services are free (for a normal usage) but require a key to allow you to use them.
The very first thing is to get an API key using the link provided in the guide and follow the few steps. As I already had one I didn’t went through this.
As my wish is to have a marker on the map I jumped directly to the Simple Marker example.
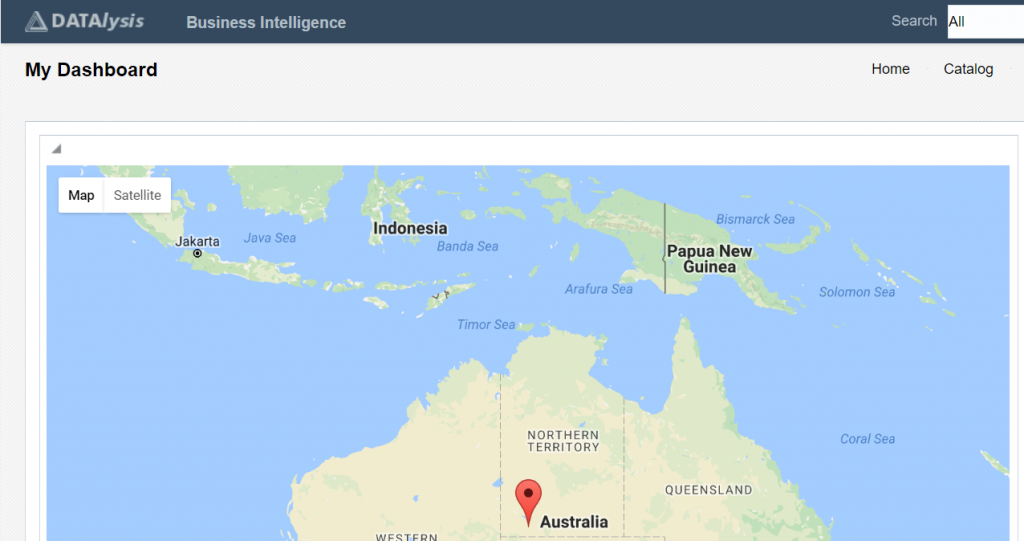
The piece of code is really simple and I don’t really care right now if it will show me Australia instead of my own location, all I want is to see a map on my analysis first.
|
1 2 3 4 5 6 7 8 9 10 11 12 |
<div id="map"></div> <script> var map; function initMap() { map = new google.maps.Map(document.getElementById('map'), { center: {lat: -34.397, lng: 150.644}, zoom: 8 }); } </script> <script src="https://maps.googleapis.com/maps/api/js?key=YOUR_API_KEY&callback=initMap" async defer></script> |
Google explain the code quite well, but let’s highlight the important parts:
- DIV element with an ID, this ID is used to identify the element where the map will be displayed
- YOUR_API_KEY in the link to the external (hosted by Google) javascript file, replace it with your own key
- callback function “initMap” in the link to the external javascript file, can be replaced by what you want, this javascript function will be executed once the library is loaded.
To add this piece of code into an analysis, I used a narrative view as I will want to make the map dynamic by passing values returned by my analysis and the narrative view is the simplest way to do it. Do not forget to tick the “Contains HTML Markup” checkbox!

By default the Content Security Policy jump in and prevent you to load the Google map javascript file.
Nothing appear on the screen, and when you open the javascript console of your browser (Developer tools in Chrome and IE11, Web console in Firefox) the reason is quite explicit.
Content Security Policy (CSP) is a computer security standard introduced to prevent cross-site scripting (XSS), clickjacking and other code injection attacks resulting from execution of malicious content in the trusted web page context. It is a Candidate Recommendation of the W3C working group on Web Application Security, widely supported by the modern web browsers. [wikipedia]
CSP is blocking any script or object coming from a different domain than the one the page belong to if not explicitly allowed by a CSP directive. This is really good as in the past it was possible to load any random javascript file hosted somewhere on any site and do things with it. Most of the time it was to display visualizations but that file was also able to steal the content on your screen and send it out to any random, not friendly, server / organization.
Configure CSP directives in OBIPS
How to set a CSP directive in OBIEE? The documentation must have an answer and it actually does: https://docs.oracle.com/middleware/1221/biee/BIESG/answersconfigset.htm#BIESG9326
The syntax is simple and sites like https://content-security-policy.com/ provides some extra details on the possible values to use.
After some testing (allow one element, retry, add the new blocked references etc.) this is what I come up with:
|
1 2 3 4 5 6 7 8 9 10 11 12 13 14 15 16 17 18 19 20 |
<ContentSecurityPolicy> <PolicyDirectives> <Directive> <Name>script-src</Name> <Value>maps.googleapis.com</Value> </Directive> <Directive> <Name>img-src</Name> <Value>*.gstatic.com maps.googleapis.com</Value> </Directive> <Directive> <Name>style-src</Name> <Value>fonts.googleapis.com</Value> </Directive> <Directive> <Name>font-src</Name> <Value>'self' fonts.gstatic.com</Value> </Directive> </PolicyDirectives> </ContentSecurityPolicy> |
Adding this config into the instanceconfig.xml file (inside the <ServerInstance><Security> tags), restart OBIPS (only this one from Enterprise Manager, it takes 10 seconds) and the sample map with marker is supposed to appear.
Google map with markers
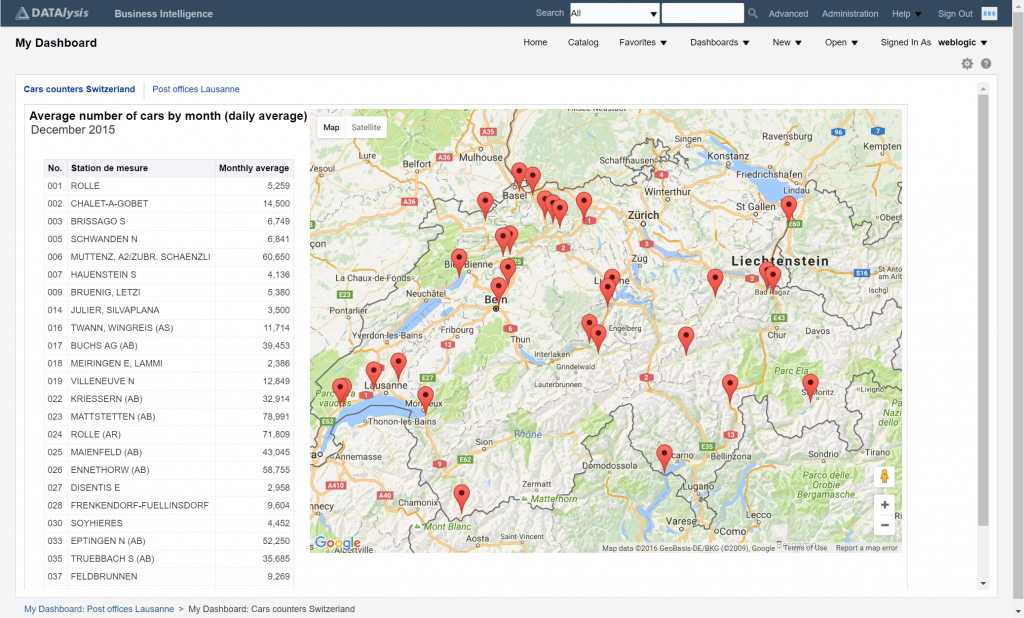
To give it a try with my own data I took a file containing locations (coordinates) of cars counters installed in Switzerland and the daily average number of cars over a month. (The data is freely available from https://opendata.swiss/en/)

The coordinates uses the WGS84 longitude and latitude format, for example 6.31994652 E, 46.44438742 N. The “title” attribute of a marker is just a text for when you mouse-over one of the markers. The code to achieve that is the previous one slightly adapted to call multiple times the “new google.maps.Marker” function to add all my markers.
Geocode an address: get the coordinates from a text
Last step is now to implement geocoding to translate a textual address in the form of street, post code, location into a format the map can understand to place a marker (WGS84 decimal coordinates). For this example I took the list of post offices in the area of Lausanne (Switzerland) with the name of the post office and the address.
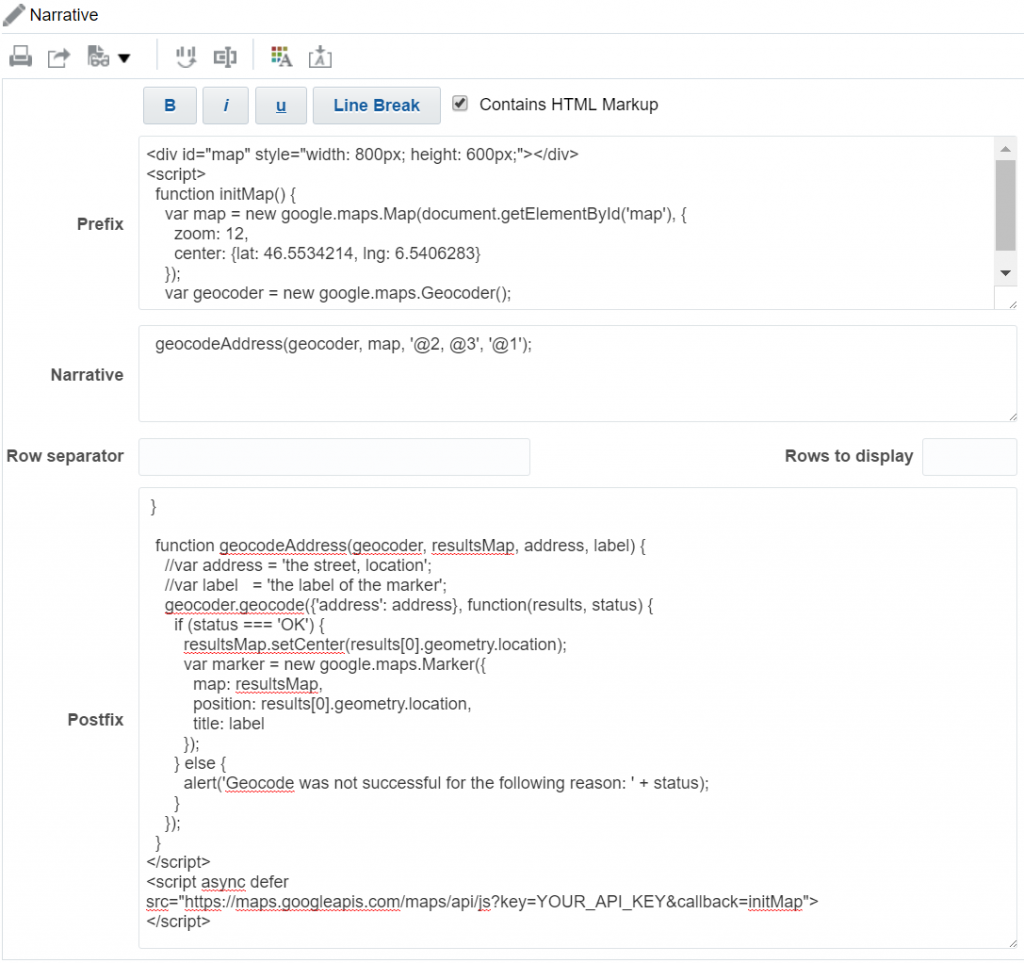
The geocoding code sample on Google Maps examples gives all the logic. All I needed to do was cut the code in pieces to use it in a narrative view, to call the “geocodeAddress” function as many times as needed.

The call to the “geocodeAddress” function receive as parameters the address and name of the post office as label for the marker.
Done !
I have now a Google map embedded into my analysis and I can display on it markers with coordinates or from textual addresses. The Google samples provide many more example of things it’s possible to do on these maps.
Geocode upfront
Please keep in mind the geocoding calls are limited, so if you geocode 50 address on a map you will get errors because of too many queries. Consider doing the geocoding once upfront and store the coordinates in your database as it will be faster to display and you will not be blocked by the API query limits.


hello please :@3,@4,@2,@1,It corresponds to what
Hi,
@n (where n is a number from 1 to N) is the syntax used in a narrative to reference the value of the columns of the Criteria tab. @1 will reference the value of the first column, @2 is the second column etc.
It’s the official syntax to have the values returned by the analysis passed to the narrative.
yes I know that,but i would know the value of this variable,for exemple the variable @3 and @4 It corresponds to Longitude and latitude, How you collect it, is it that exists in the anlysis,thanks
Yes, @3 and @4 are latitude and longitude while @1 and @2 where just ID and name of the place. They were attributes in my dataset.
Having full text addresses and translating into coordinates “on the fly” using the Google APIs isn’t livable: first the API limits the number of free translations per month, second it’s slow.
So translate your places into coordinates once and store them as attributes in your model.
ok thanks you
I tried both code but I had a static card in both cases
A “static card”? You mean your locations aren’t shown on map? I would say you maybe have an issue on the JS side, so you maybe want to double check your code by using just few fixed points first to make sure your code is right.
yes i can’t see the location,i have have same code as you,
function initMap() {
var map = new google.maps.Map(document.getElementById(‘map’), {
zoom: 8,
center: {lat: -34.397, lng: 150.644}
});
var geocoder = new google.maps.Geocoder();
geocodeAdress(geocoder,map,’@1′,’@2′);
}
function geocodeAddress(geocoder,resultsMap,adresse,label) {
//var address = ‘the strret,location’;
//var label=’the label of the marker’;
geocoder.geocode({‘address’: address}, function(results, status) {
if (status === ‘OK’) {
resultsMap.setCenter(results[0].geometry.location);
var marker = new google.maps.Marker({
map: resultsMap,
position: results[0].geometry.location
});
} else {
alert(‘Geocode was not successful for the following reason: ‘ + status);
}
});
}
and thid my table for anlysis
city company
marseille cgi
colmar capgimini
Even with fixed values it does not work
You know what it does mean then, right? You have an issue in your code interacting with Google APIs. Last October at time of writing the code was the one in the blog post, now they maybe changed their APIs. Go on the Google sites and read their APIs documentation and example to find the right code.
Your problem isn’t OBIEE related but Google Maps API related…
i see the example in google site web is the same code as you,i can display the map with the marker in a navigator as html page but not in obiee
Are all the files required loaded correctly? Is the CSP config in place and allowing all the required files? What do you see when you look in your browser’s developer tools? You will probably see javascript errors or load errors because of CSP or any other reason.
It was a problem of my code, thank you very much
my problem what I can not display the map in satellite mode,it cannot display the picture,i didn’t undrestand why
Did you check the Google documentation on how you are supposed to show the pictures? Did you check if the pictures aren’t blocked by CSP when trying to load? Your issue being a Google Map thing you have to look in that direction, it isn’t directly an OBIEE thing (except if CSP, in which case you need to add the extra required config).
Is there an api for that or maybe it’s a code problem,thanks
for the csp,i did the some configuration as you,i dont know how to check if the pictures aren’t blocked by CSP when trying to load
First screenshot of the blog post, I thought you would have read it as you post comments 😀
I did the config based on my needs, I wasn’t using pictures but standard maps, didn’t check at all pictures as I had no need.
thanks you,so i need to add the picture in the csp
it isn’t this configuration for picture???
img-src
*.gstatic.com maps.googleapis.com
It is the one to allow to load pictures from external domains, but is these the domains the pictures come from? Your browser is the one telling you if you check the console.
Hi Gianni
Im starting to play around with Google maps, and maps in OBIEE in general and came across your blog.
Im stuck at the section where you mentioned to insert the following code
[
var map;
function initMap() {
map = new google.maps.Map(document.getElementById(‘map’), {
center: {lat: -34.397, lng: 150.644},
zoom: 8
});
}
]
I created an empty report, and added a narrative.
In the narrative, I took that chunk of code and inserted it into the “Narrative” section.
I then hit the error with CSP, and as suggested I modified my instanceconfig file.
I now no longer get any CSP error, though the map is not displaying at all.
There is no error message, just a blank report.
Does that chunk of code need to be split up into the prefix or postfix sections?
If so how does it get broken down?
I used my own API from google, and that seems to be working fine, its just I am not getting any map display.
I am just trying to get the map to display, then proceed to play around.
Well, assuming Google didn’t change their API in the meantime you are supposed to get something or a message at least at some point. It’s true that this code need to be in the “prefix” or “postfix” but not in the “narrative” part of the Narrative view, because the “narrative” part is repeated for each row of your dataset. So just put it fully in the “prefix” and you will be fixed.
Also remember you can add ” console.log(“your message”) ” in the code to log things and see the messages in the browser’s console. In that way you can debut things and make sure the code is executed, function initMap executed, that “map” is really defined and it’s an object etc.
Hy Gianni, I’m trying create the map, but when I enter value for position {lat: @ 2, lng: @ 3} returns function error initMap not created. How i solve this? Thanks
Hi Fernando,
Would need some more info on what you are trying exactly (and also the version you use) to be able to maybe help you.
I use the 12C version of OBIEE. I can make the map work correctly through the narrative, however I can not use it in a dashboard with filters by municipality.
This kind of map depends totally on the analysis. It isn’t meant to be as interactive as a real map from MapViewer which will have the various layers you define, filters, drill down etc.
ok, thanks for all
Hai,I already set the CSP on instanceconfig.xml, but when i see my browser developer tools i still got the refuse error on it. Did i missing something?
Thank you
Hi, I assume you restarted the presentation service after setting the CSP in instanceconfig.xml and you still have an error. Look at the error, it does tell you exactly which domain and which kind of access it tries to do, so you can adjust the CSP config accordingly. The post being almost 2 years old I don’t exclude Google changed their APIs a bit and so other domains or access are required.
Hi Gianni, great post!
I’m trying to create a google maps report on my OBIEE 12c Environment.
I’ve followed all the steps and looked at the new documentation for google API but I cannot manage it.
It looks my OBIEE is not drawing the div; on the browser console everything looks good (no CPS error, no warning), I can either can see a message like:
“Finished loading https://maps.googleapis.com/maps/api/js?key=AIzaSyA5T2jGNjUyciZFigEZoW3hvV-WWPTpGbo&callback=initMap”
I’ve tryed to embed the code in a .html file putting it on my AnalyticsRes folder and opening it froma browser..and I can see the map; so it’s not a server issue…any suggestion?
thanks in advance,
M
Hi Marco,
Good thing is that it works in analyticsRes and therefore the API key and these things are fine. Did you try with a very random ID for your DIV to make sure it’s unique all over the page? You can even just take the Google example and add it to a dashboard page without any analysis, just to fix the issue you get with the visualization first. Also make sure the HTML is there in the page using the developer extension of your browser. These are the first things I would look for.
Btw, if you are close to Milano or Roma I hope you are coming next week to http://www.itoug.it/ ! We can even fix the maps there if you attend.
Hi Gianni,I have the same issues than Fernando, I tried to integrate this google api with obiee 12c in a narrative object.
This could be a problem around the csp configuration?
Thanks for your help
This is a 6 years old post. The APIs change over time and, while I didn’t test, I’m fairly sure Google did change the API.
Keeping it simple: OBIEE is “just” a webpage. If you can get your map to work in a normal webpage, it will work in an OBIEE page. If it doesn’t the browser console should give you some hints about what is wrong.
The CSP list of things to allow maybe changed, but here again the API probably has a page listing what is needed. And if you have a CSP issue it is explicitly visible in the browser console.